Forecasting insights generator: Produce insights from historical performance data
The forecasting insights generator helps finance teams track performance, manage budgets, and analyze kpis efficiently for informed decisions.

Similar apps

Cash flow projection generator
Cash flow projection generator: Automatically project cash flows from input variablesProfitability report builder
Profitability report builder: Craft profitability reports based on user inputVariance analysis reporter
Variance analysis reporter: Create reports on budget variances automaticallyPerformance report generator
Performance report generator: Generate structured reports from input data
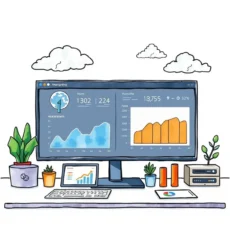
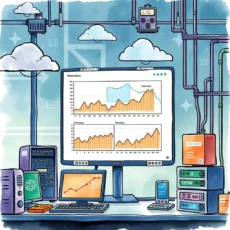
Unlock powerful financial insights through data analysis
Transform historical performance data into actionable forecasts
Input fiscal year for precise reporting
Easily enter the fiscal year relevant to your report. This feature ensures that your insights are aligned with the correct financial period, allowing you to track performance accurately and make data-driven decisions that reflect historical trends.
Specify department for tailored performance tracking
Input the department name to generate insights specific to each segment of your organization. By honing in on departmental performance, you can identify strengths and weaknesses, facilitating targeted improvements in budget allocation and resource management.

Enter budget amount for accurate comparisons
Provide the budget amount for the reporting period to contextualize performance figures. This allows for precise analysis and helps stakeholders understand variances between budgeted and actual performance, promoting better financial strategies for future periods.
Submit actual performance figures for analysis
Input actual performance data relevant to your organization. The system processes this information against projected figures to highlight trends, inefficiencies, and successful strategies within your financial planning, paving the way for informed decision-making.

Variance explanation for enhanced understanding
Explain any variances between expected and actual results directly within the tool. By articulating these discrepancies, stakeholders gain a clearer understanding of underlying factors affecting performance, making it easier to adjust forecasts or operational tactics accordingly.

Track key performance indicators (kpis) effectively
Specify key performance indicators critical to assessing Departmental success. With this feature, you can monitor crucial metrics consistently over time, ensuring focus remains on areas driving business objectives while allowing quick adaptations as needed based on ongoing results.

Select reporting period for consistent insights
Choose from various reporting periods such as monthly or quarterly. This flexibility allows users to adapt analysis preferences based on organizational needs and reporting schedules while providing a comprehensive view of financial health across timeframes.

Document assumptions made during forecasting
This field facilitates transparency by allowing users to record any assumptions driving their forecasts. Documenting these insights helps analysts justify their predictions during discussions with stakeholders, strengthening trust and accountability throughout the reporting process.

List stakeholders involved in reporting process
Enter names of key stakeholders integral to each report's accuracy. This feature promotes collaboration among team members by clarifying roles in the reporting process while fostering transparency and communication necessary for comprehensive financial oversight.

Add additional notes or comments easily
Utilize this section for any further context needed regarding the report’s findings or methodologies. By incorporating additional notes or comments, users can provide comprehensive explanations facilitating better understanding among team members involved in performance evaluations.
Additional information
Best for: Budget Analyst, Financial Reporting Analyst, Forecasting Manager, Performance Reporting Specialist, Financial Analyst