Visual data publisher: Craft visual summaries from textual data insights
Create insightful reports with visual data publisher, featuring data sources, visualizations, and key metrics for better decision-making.

Similar apps
Maximize your data insights with comprehensive visual summaries
Transform textual data into engaging visual reports tailored to your audience

Streamlined input process for complete reports
Our intuitive form captures essential details like report title, description, data source URL, and visualization type. By ensuring every key metric and audience insight is accounted for, you can significantly enhance the quality of AI-generated visual summaries.

Tailored visualization types to suit any need
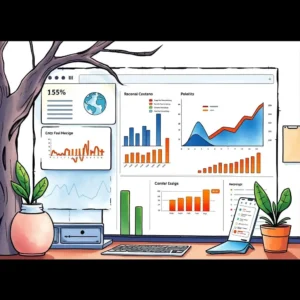
Choose from various visualization options including bar charts and line graphs to effectively convey your data story. This flexibility allows Data Visualization Specialists and Analysts to present complex information in a visually appealing format that resonates with your target audience.

Customizable date ranges ensure relevant reporting
Adapt your data visualizations by selecting specific date ranges for your reports. This feature allows Business Intelligence Analysts and Reporting Specialists to focus on the most pertinent timeframes, delivering insights that matter most to stakeholders.

Highlight key metrics with precision
Select important metrics to emphasize within your report, ensuring clarity and focus on critical data points. This function is designed for Reporting Analysts looking to streamline their presentations and provide decision-makers with valuable insights quickly.

Add specific insights for enhanced context
Incorporate unique trends or insights that may influence decision-making in your reports. By leveraging this additional information, Data Report Developers can create more robust narratives within their visual summaries, making their findings even more impactful.

Comprehensive notes section for additional clarity
Utilize an additional notes field to provide context or other relevant comments regarding the report. This enables BI Report Specialists to add personalized touches or clarifications that enhance the understanding of the data presented.
Additional information
Best for: Business Intelligence Analyst, Data Visualization Specialist, Reporting Analyst, Business Intelligence Developer, Data Analyst


