Data visualization text generator: Transform results into easy-to-understand narratives
The data visualization text generator helps researchers summarize experiments, visualize data effectively, and create engaging presentations with ease.

Similar apps

Results presentation assistant
Results presentation assistant: Help structure effective presentations of research resultsOutcome communication tool
Outcome communication tool: Convey research outcomes in an engaging formatExperiment conclusion editor
Experiment conclusion editor: Draft coherent conclusions based on data outputsResult explanation generator
Result explanation generator: Write straightforward explanations of experimental resultsResearch findings presenter
Research findings presenter: Create compelling descriptions of research outcomesResearch discovery summarizer
Research discovery summarizer: Outline important discoveries from lab experiments


Elevate your research with comprehensive text generation tools
Transforming data into insightful narratives for r&d professionals

Seamless input fields for comprehensive experiment details
Easily fill out multiple fields including title, date, researcher names, and description to provide context. This structured input ensures that the text generator captures all key information necessary for generating insightful narratives, enhancing clarity and precision in reporting research findings.
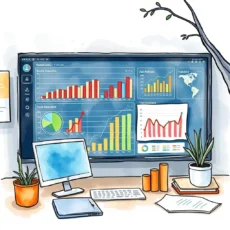
Tailored visualizations to enrich your findings
Select from various data visualization types such as bar charts or line graphs to complement your experiment results. This feature allows researchers and data analysts to present complex information visually, aiding comprehension and facilitating informed discussions in presentations.
Detailed output including key findings and comments
Receive well-structured outputs from key findings and additional notes entered into the system. By integrating these elements, the text generator produces a comprehensive narrative that effectively communicates experiment outcomes while retaining essential commentary from researchers.

Future presentation date integration
Specify a presentation date to align generated narratives with upcoming events. By including this feature, users can ensure their outputs are not only timely but also relevant to their specific audience, promoting efficiency in research preparation and delivery.
Additional information
Best for: Research Scientist, Lab Technician, Experimental Scientist, Data Analyst, Research Associate